Result Outputs
Sample dataset
The following sections present the results obtained from interferENZY analysis in the form of output report files (general report and analysed time-course coordinates), together with graphical outputs showing the treatment and analysis of the provided dataset.
Product vs time time-courses
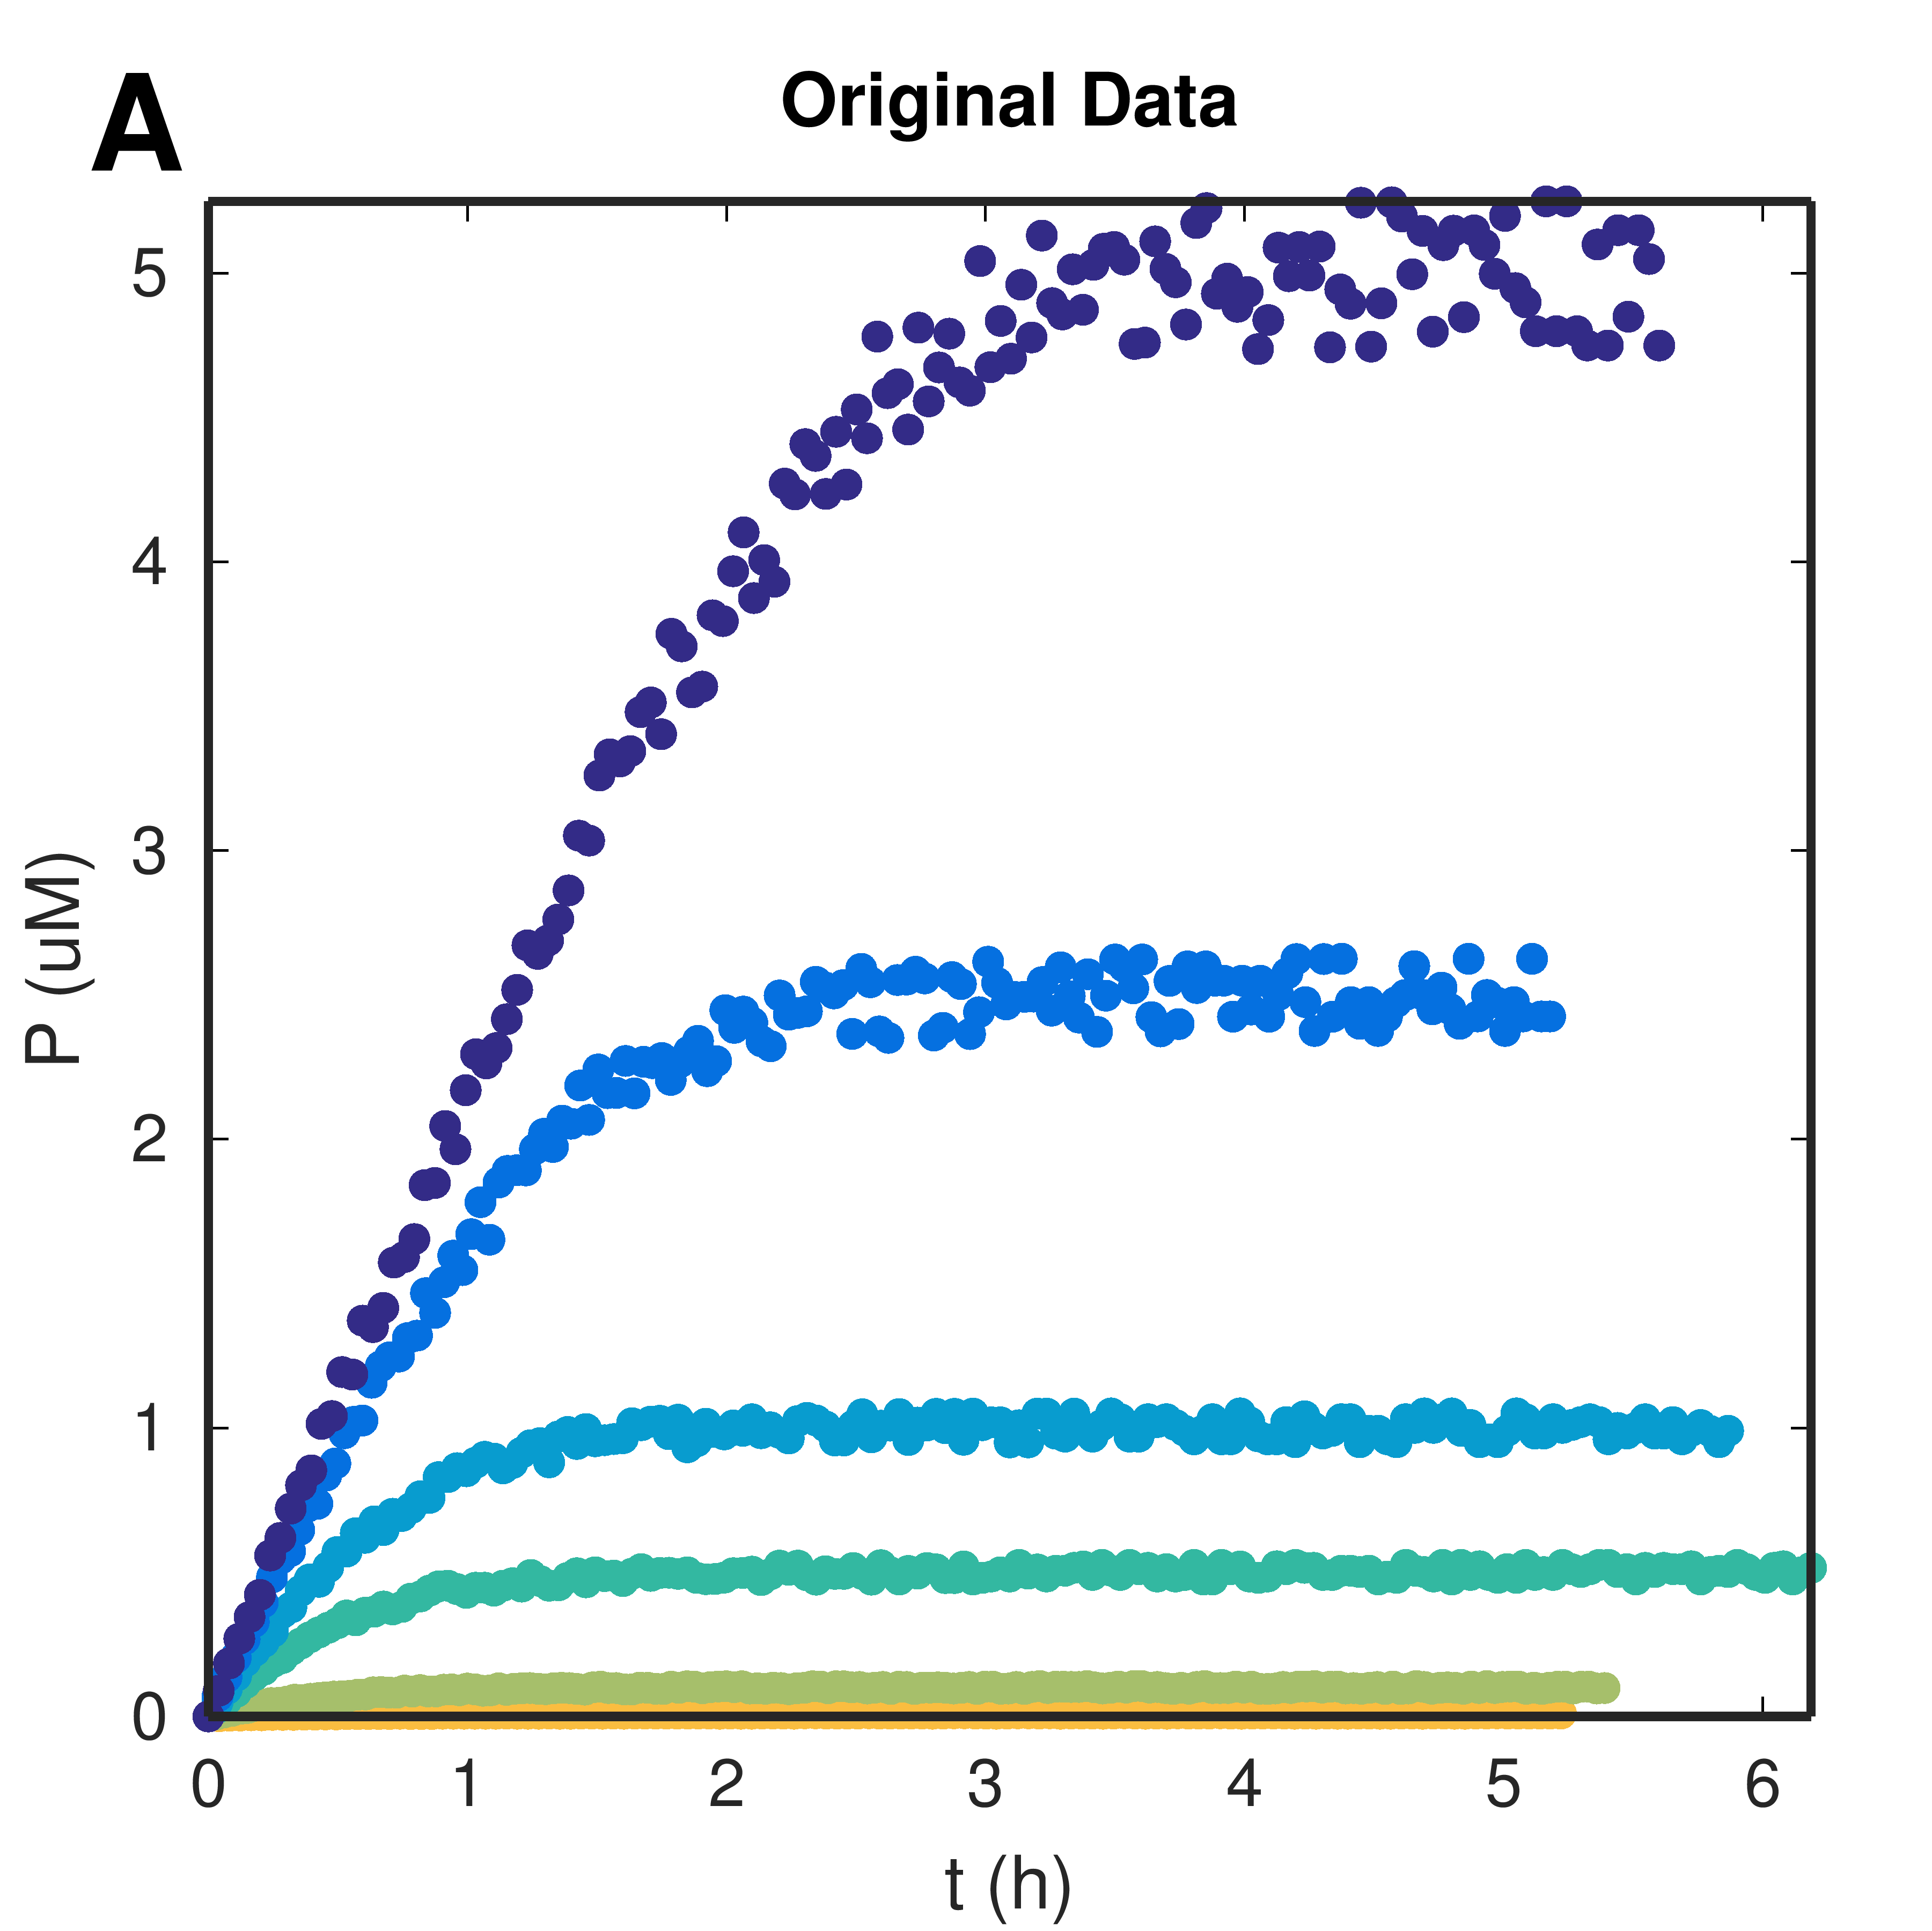
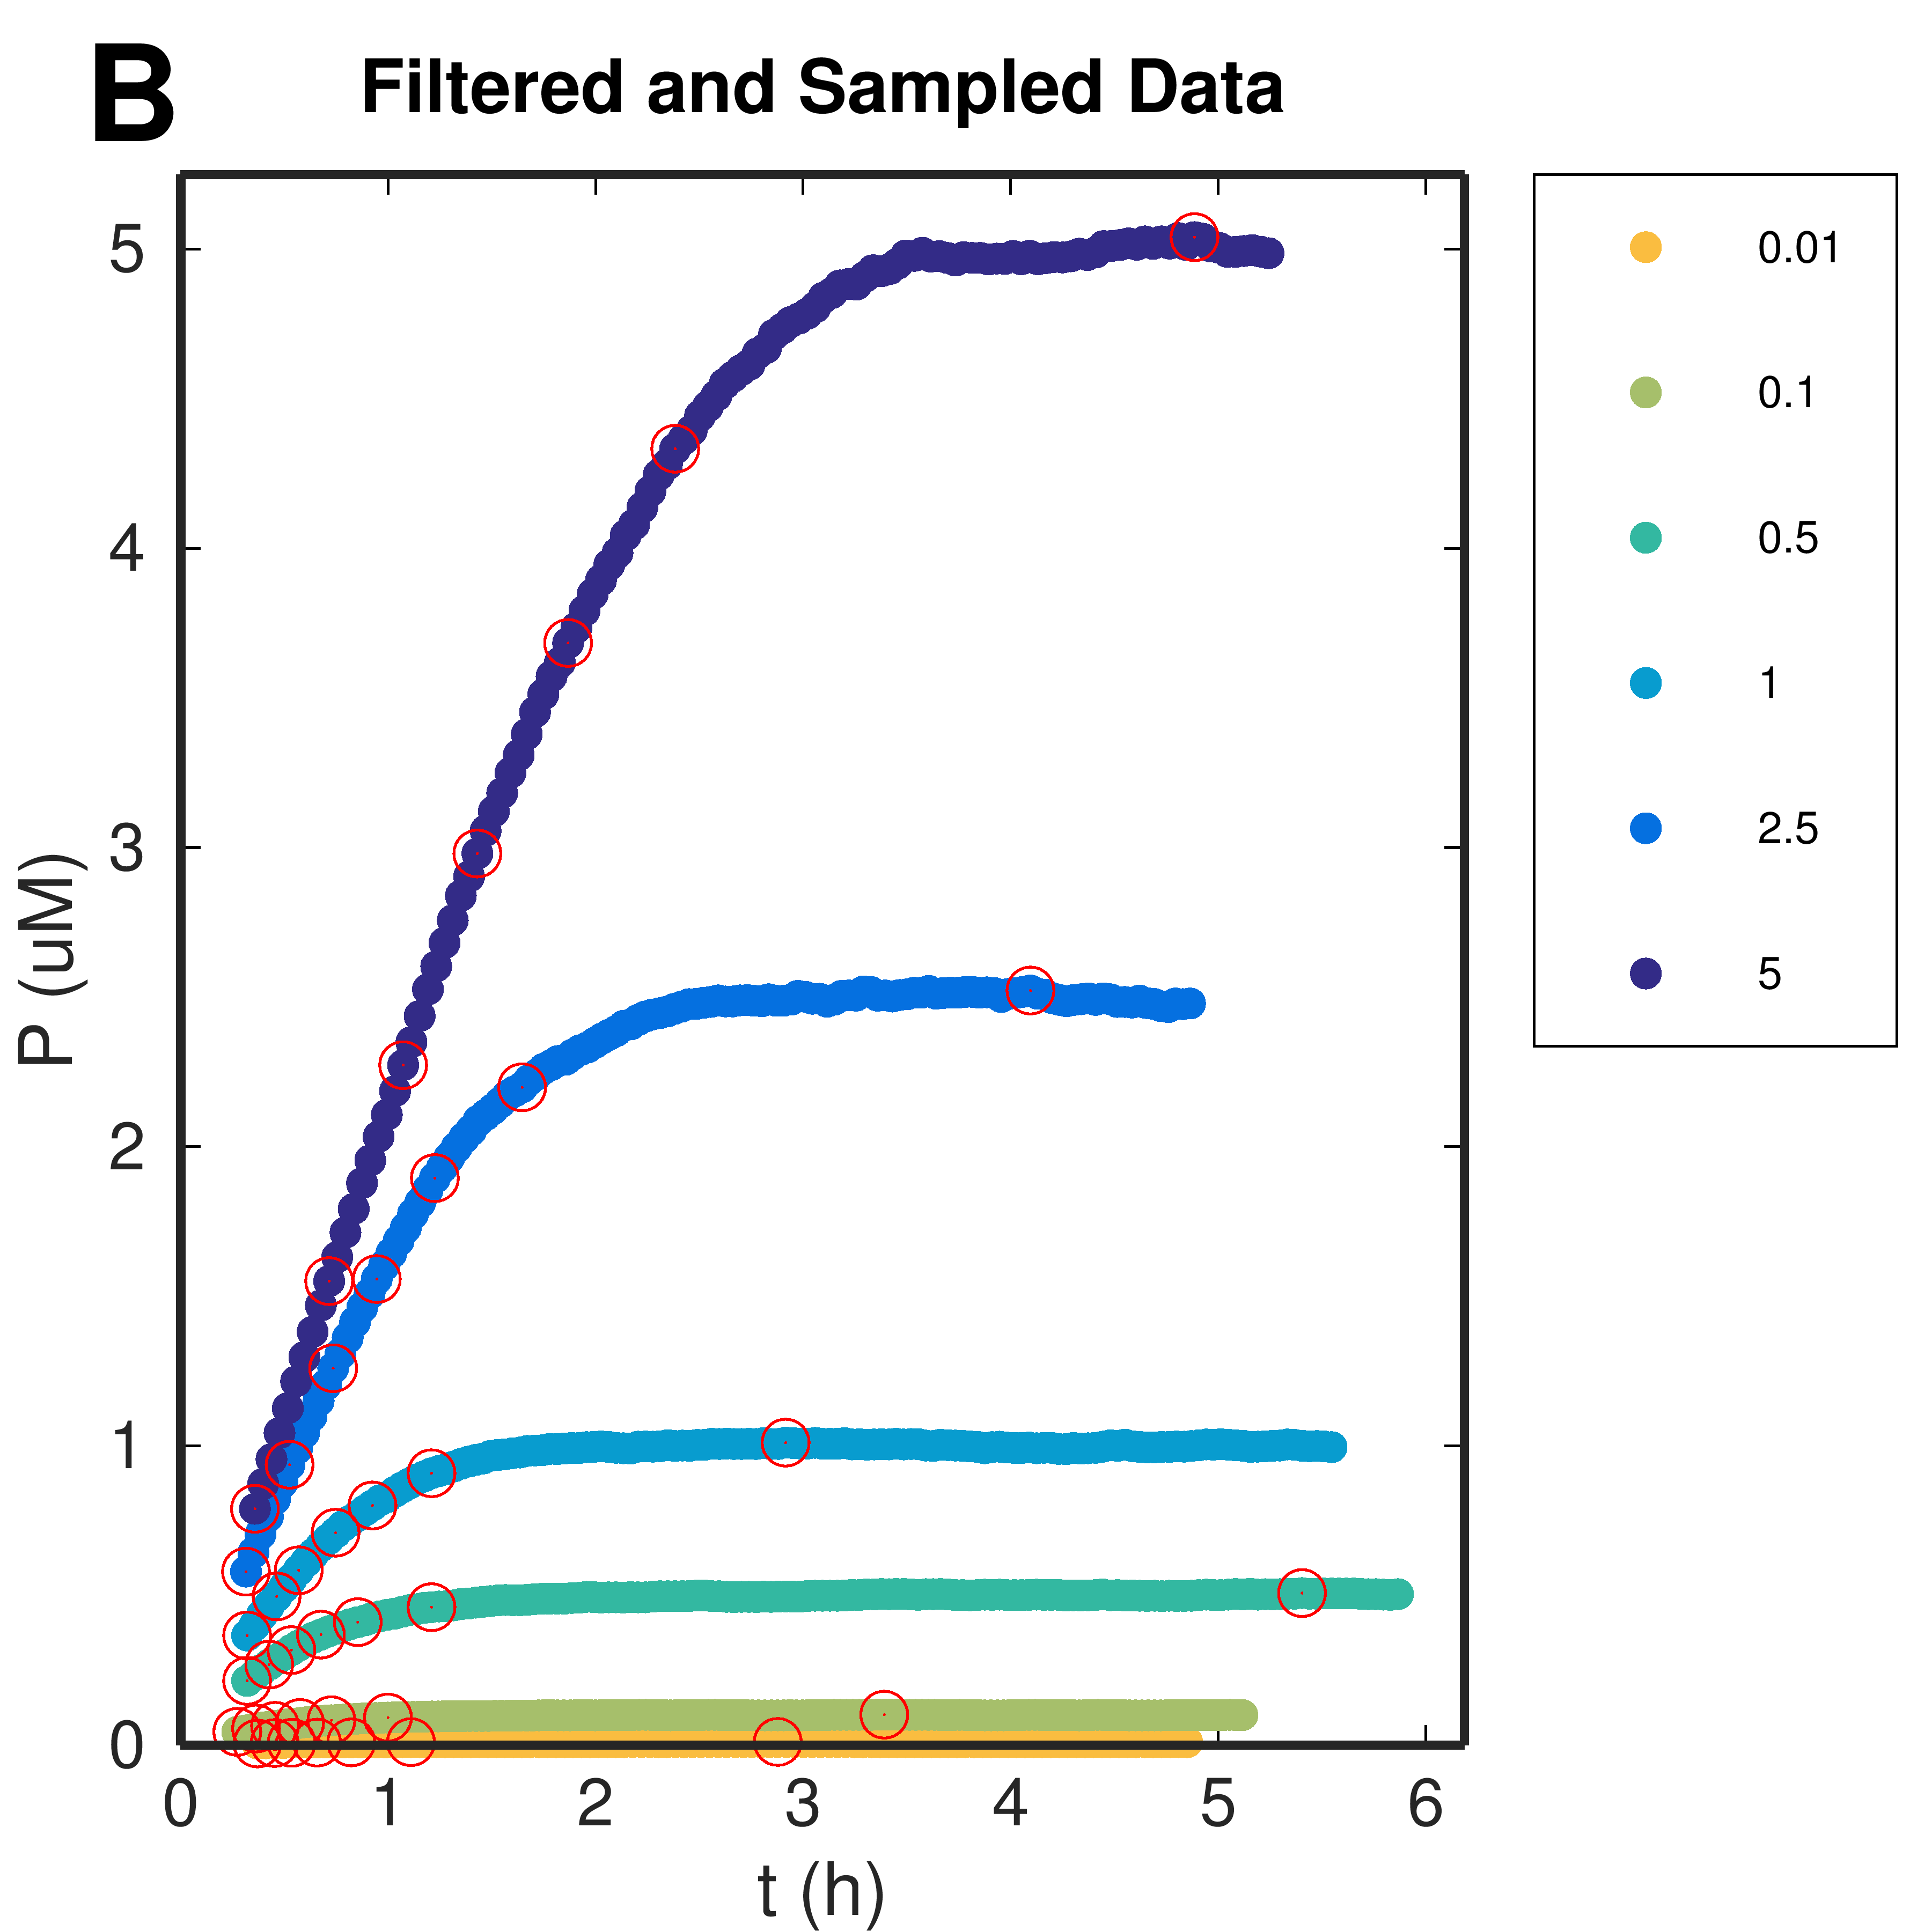
Figure 1. Progress Curves: application of moving average filter and sampling. (A) Submitted raw data calibrated and (B) data after filtering and sampling procedures. Markers indicate the product-wise sampled points.
Download Hi-res file (A) Download Hi-res file (B)Data filtering and sampling procedures
Time-courses are smoothed (to remove assay/instrument noise) by a moving average filter, and 7 timepoints are sampled, product-wise.
Moving Average Filter
A pre-determined interval of points centered on a point of the curve is averaged for both time and reaction endpoint vectors:

where n is the point of the curve in which the pre-determined interval is centered, and N is the number of timepoints at each side of point n (full length of the interval is defined by 2N+1). This filtering interval is dynamically determined according to each dataset's behavior. For each curve, the number of time points for which the reaction product reaches a value corresponding to its 95th percentile is obtained; this number is divided by the number of sampled points to be obtained (namely 7). The largest determined interval in the dataset is then used for filtering all the time-courses.
Product-wise Sampling
7 points are then sampled product-wise. After determining the maximum value of P for the curve, it is divided it in 7 equally distanced values and points of the curve closest to these values are sampled, with corresponding instants.
Modified coordinate time-courses
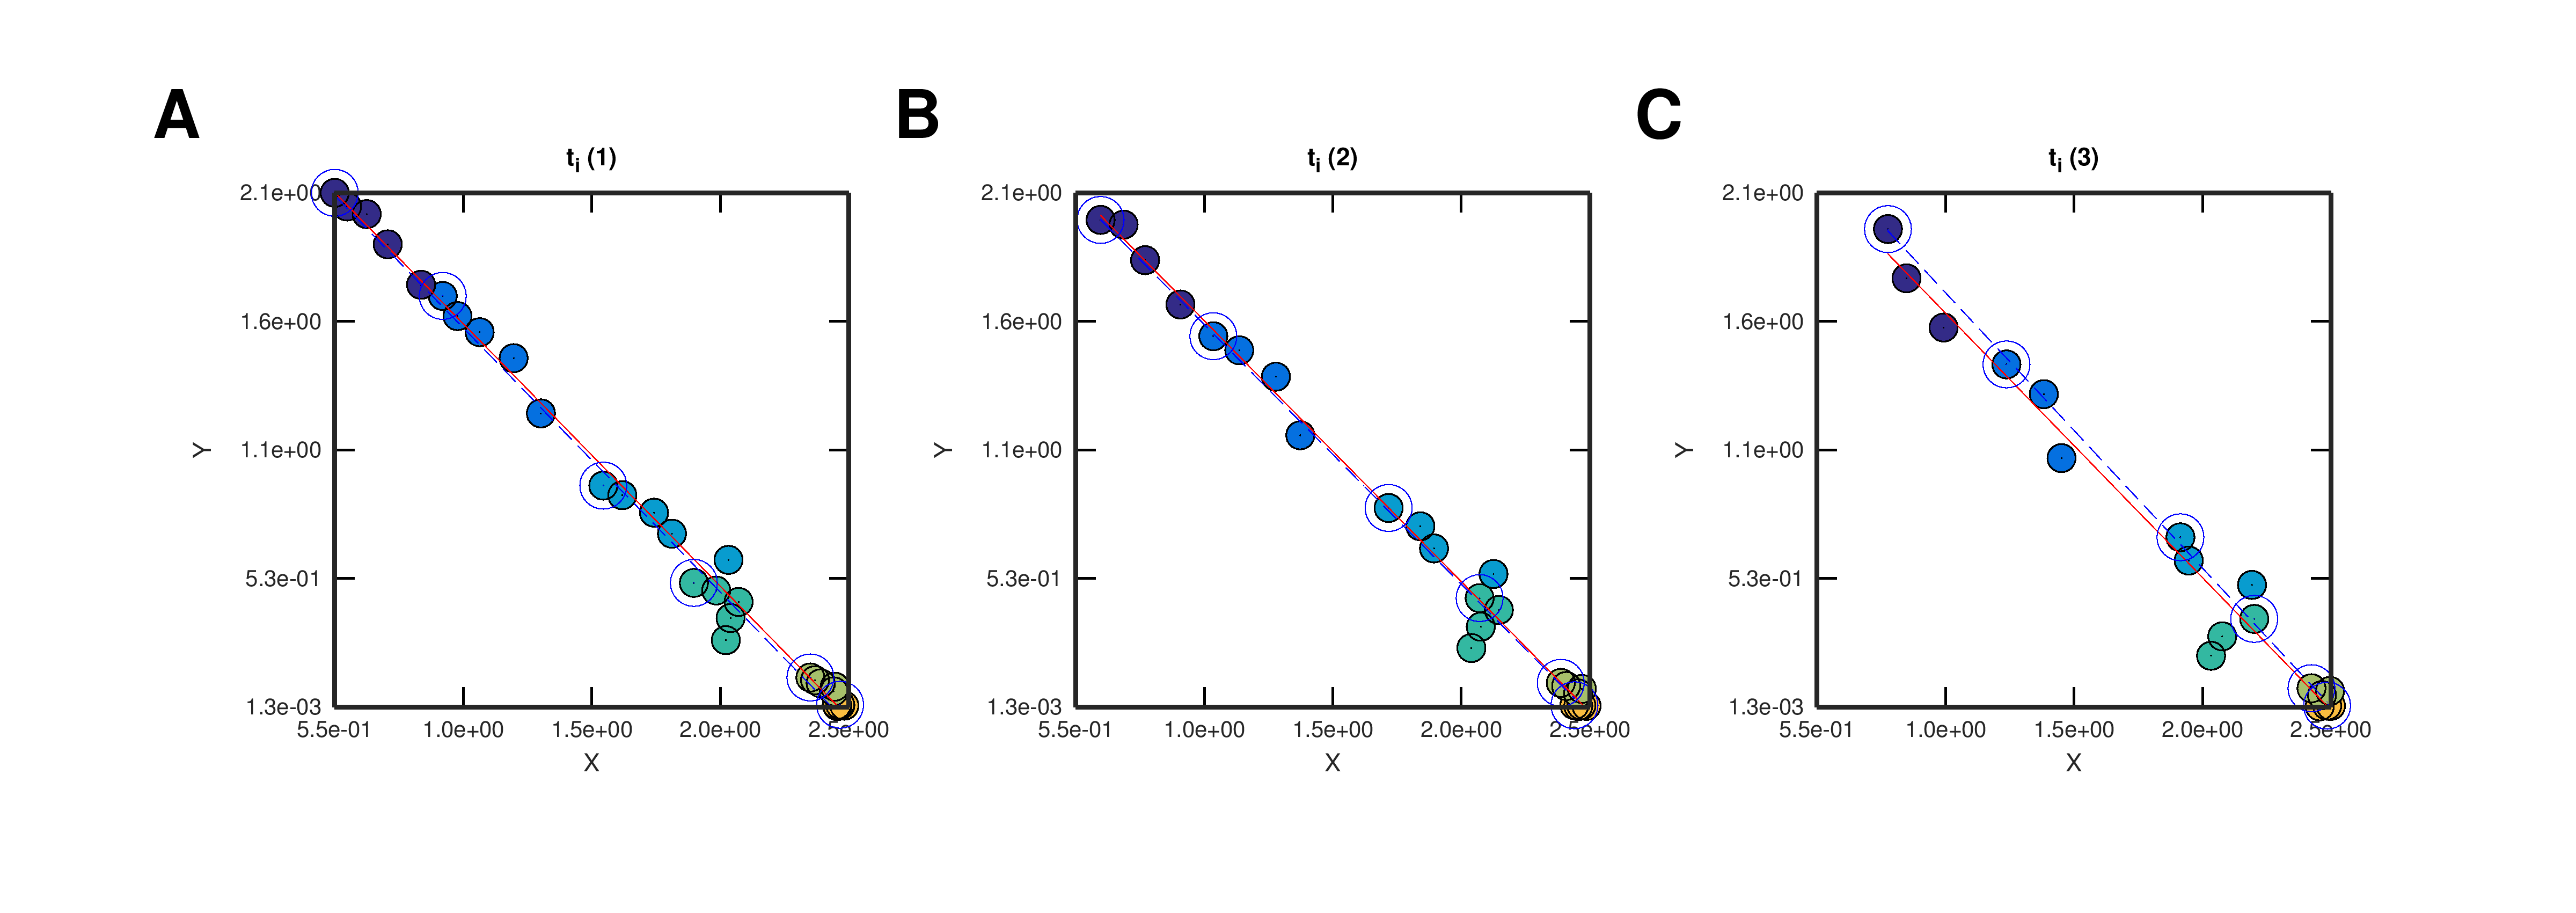
Figure 2. Progress Curves: application of the linearization method. Modified reaction coordinate sets obtained varying the first instant ti. Red and blue lines correspond to the linear regression fittings obtained using all or only initial modified reaction coordinates, correspondingly (blue open markers indicate initial coordinates).
Download Hi-res file
For datasets with fixed E0 and variation of S0, for steady-state conditions (E0«S0+Km)

Result & enzymatic assay quality control
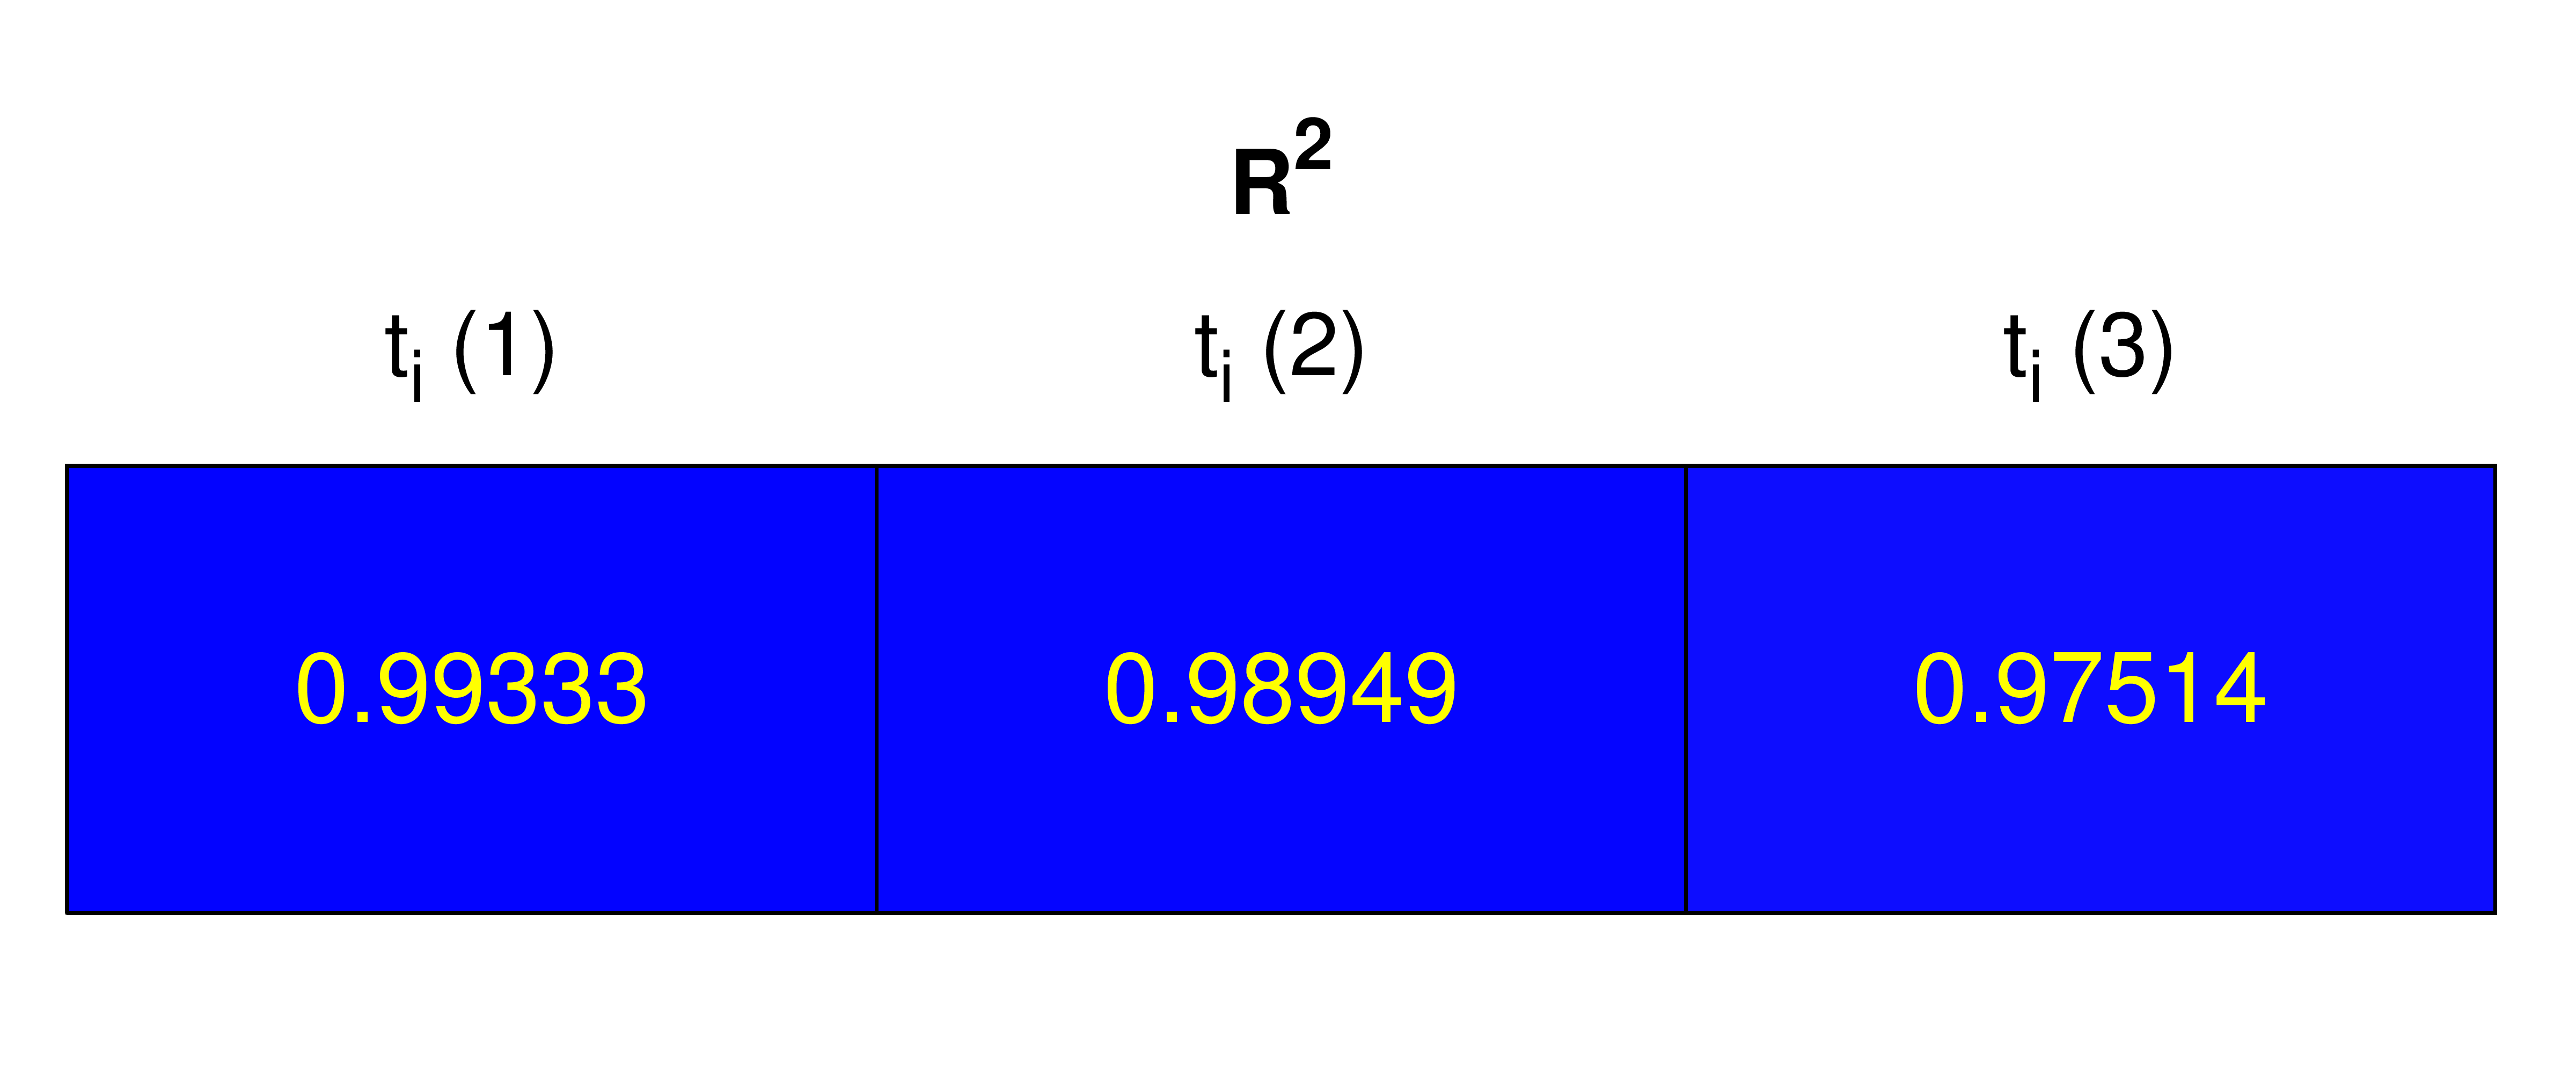
Figure 3. Heatmap representation of the Correlation Coefficients determined for all initial instant analyses (global linear fitting for the full dataset).
Download Hi-res file
R2 coefficient
The general agreement between estimated parameters obtained for all the timepoints of all curves and the corresponding overall coordinate trend is tested using the values of R2 for each linear fit. This coefficient provides a measure of how well experimental observations are replicated by the tested model, considering the proportion of total variation in the observations that can be explained by the model.
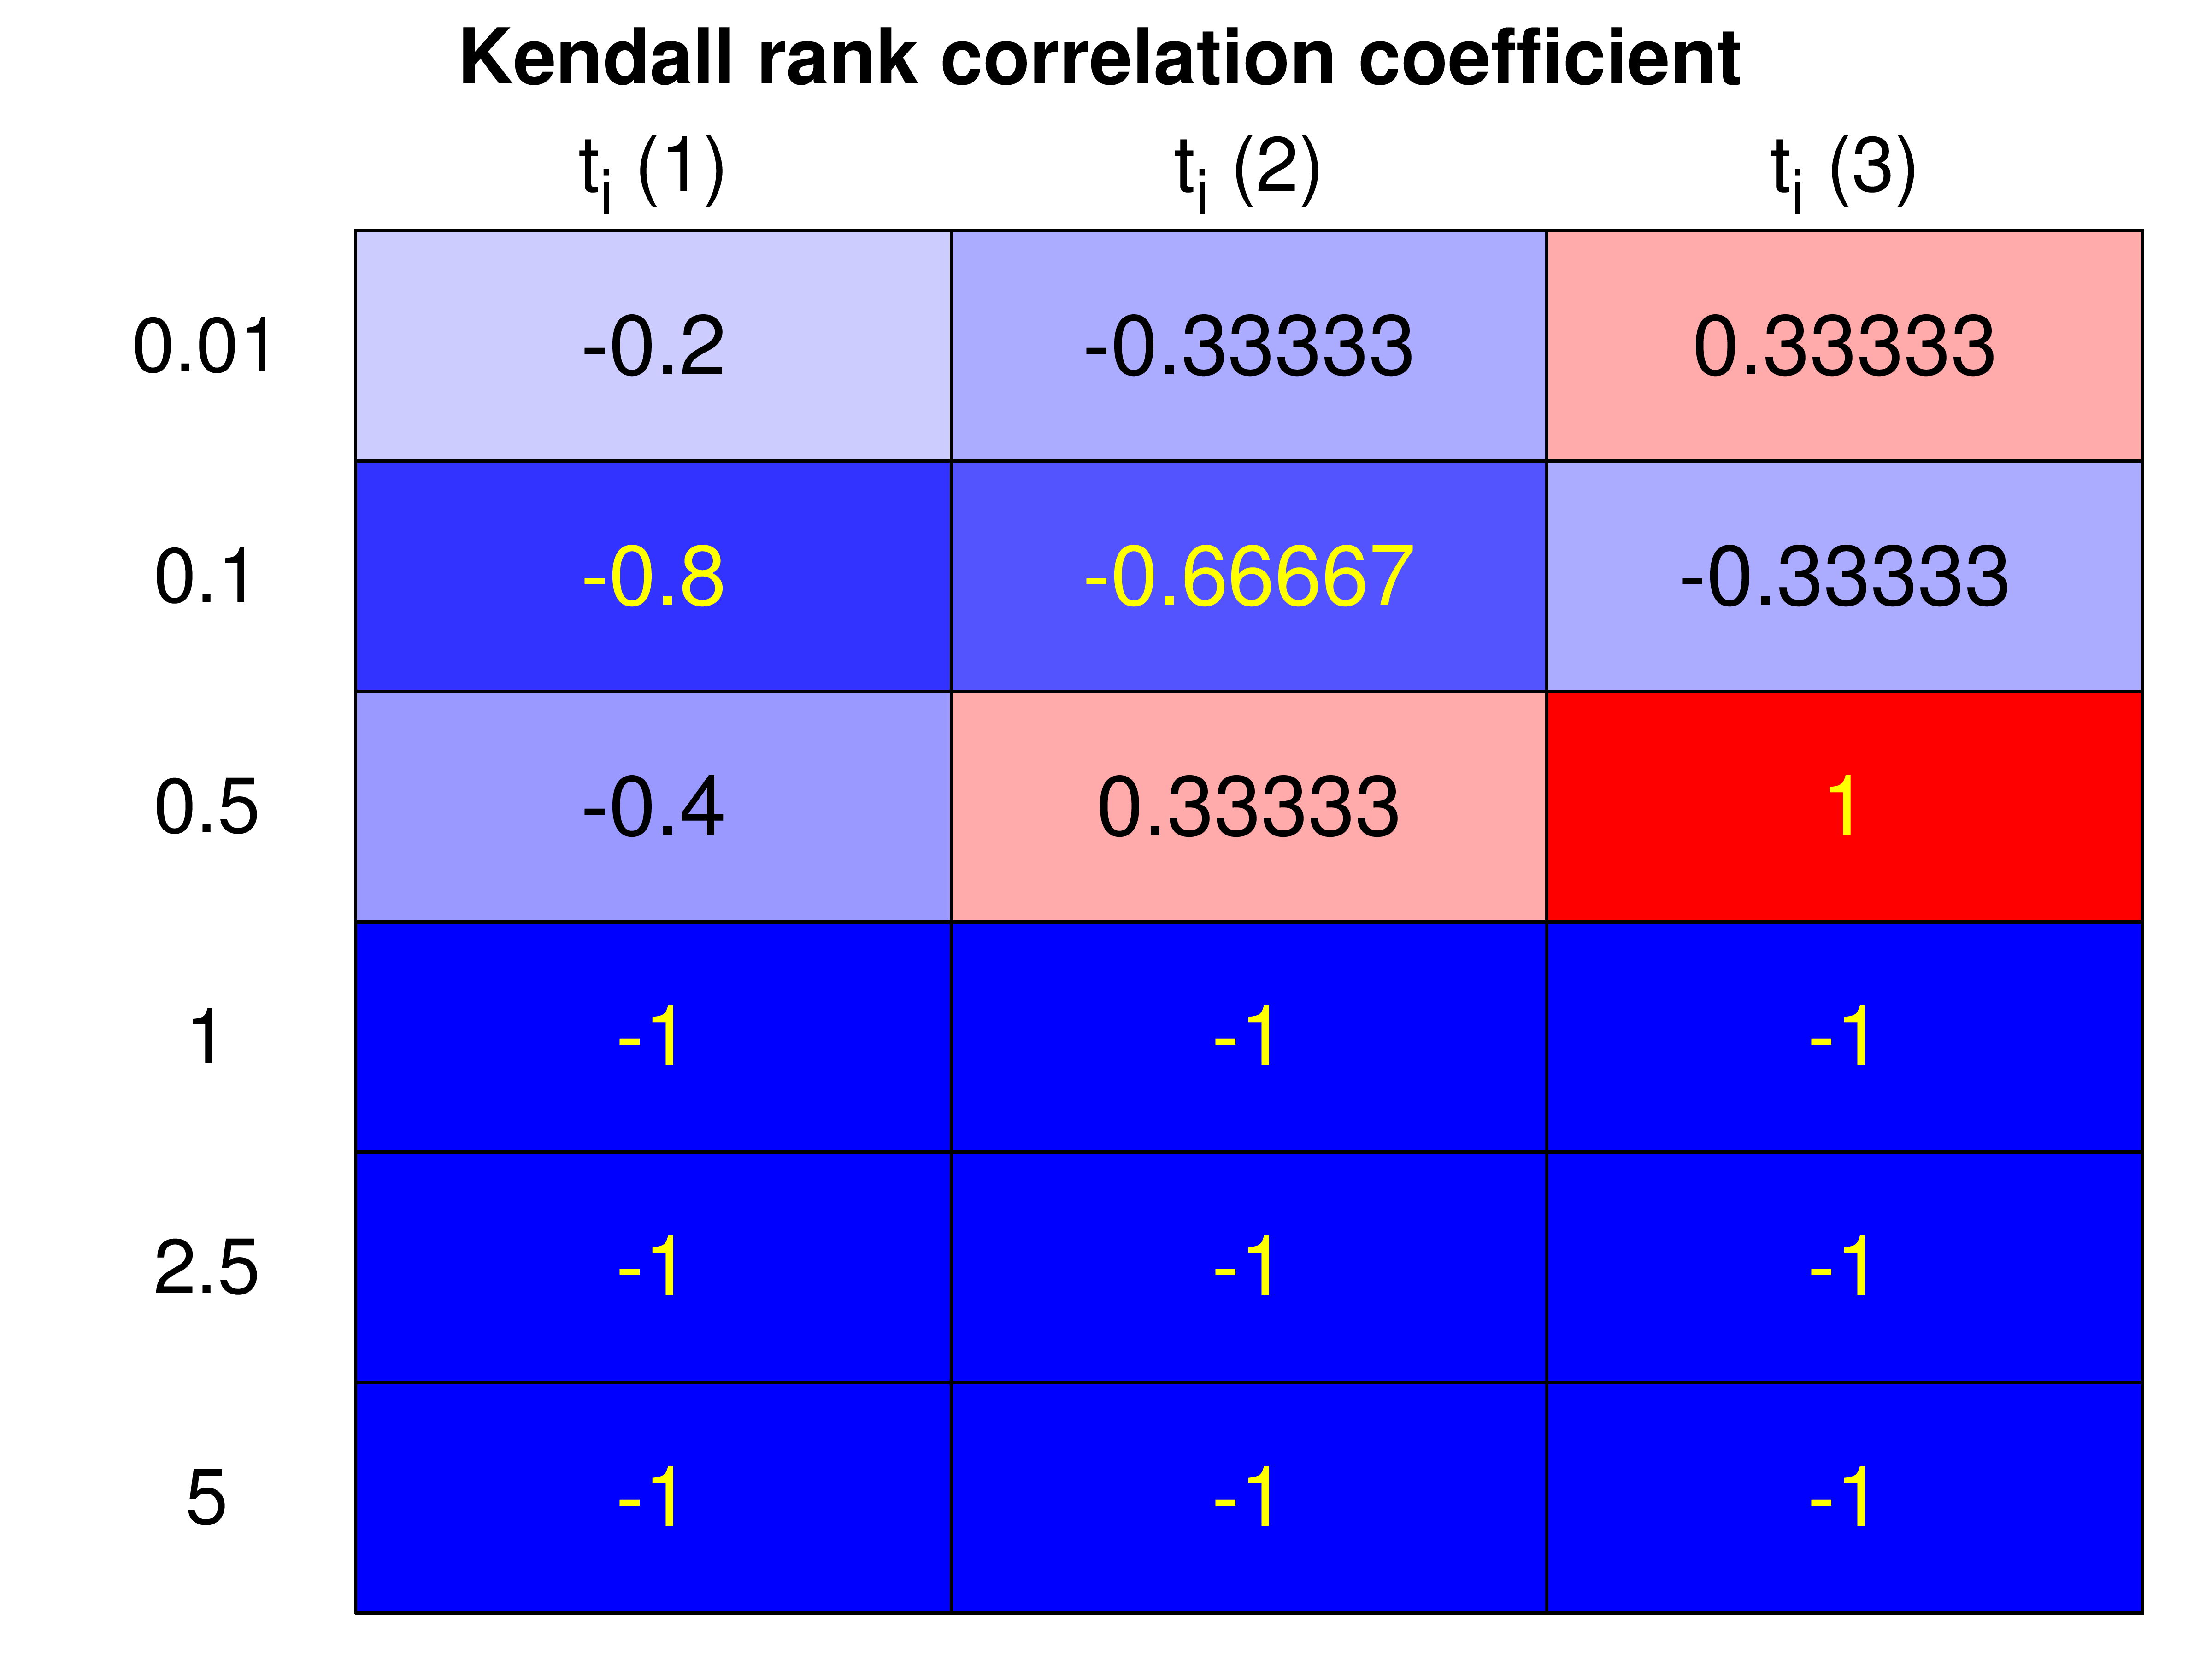
Figure 4. Heatmap representation of the Kendall Correlation Coefficients determined for all initial instant analyses and individual curves (for all S0 values).
Download Hi-res file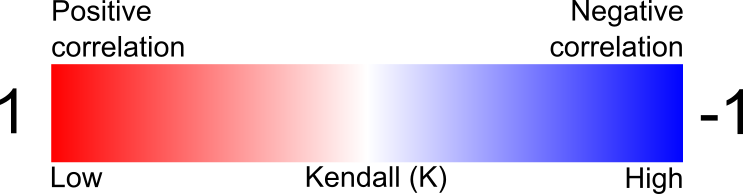
Kendall Correlation Coefficient (K)
This coefficient measures the similarity of the orderings of (X,Y) data when it is ordered by its respective quantities.
- Negative correlations are rated with a higher score: a negative slope is indicative of the expected trend (e.g., lack of assay interferences).
- Positive correlations are rated with a lower score: presence of trend opposite to the expected (e.g., due to assay interferences like enzyme inactivation).
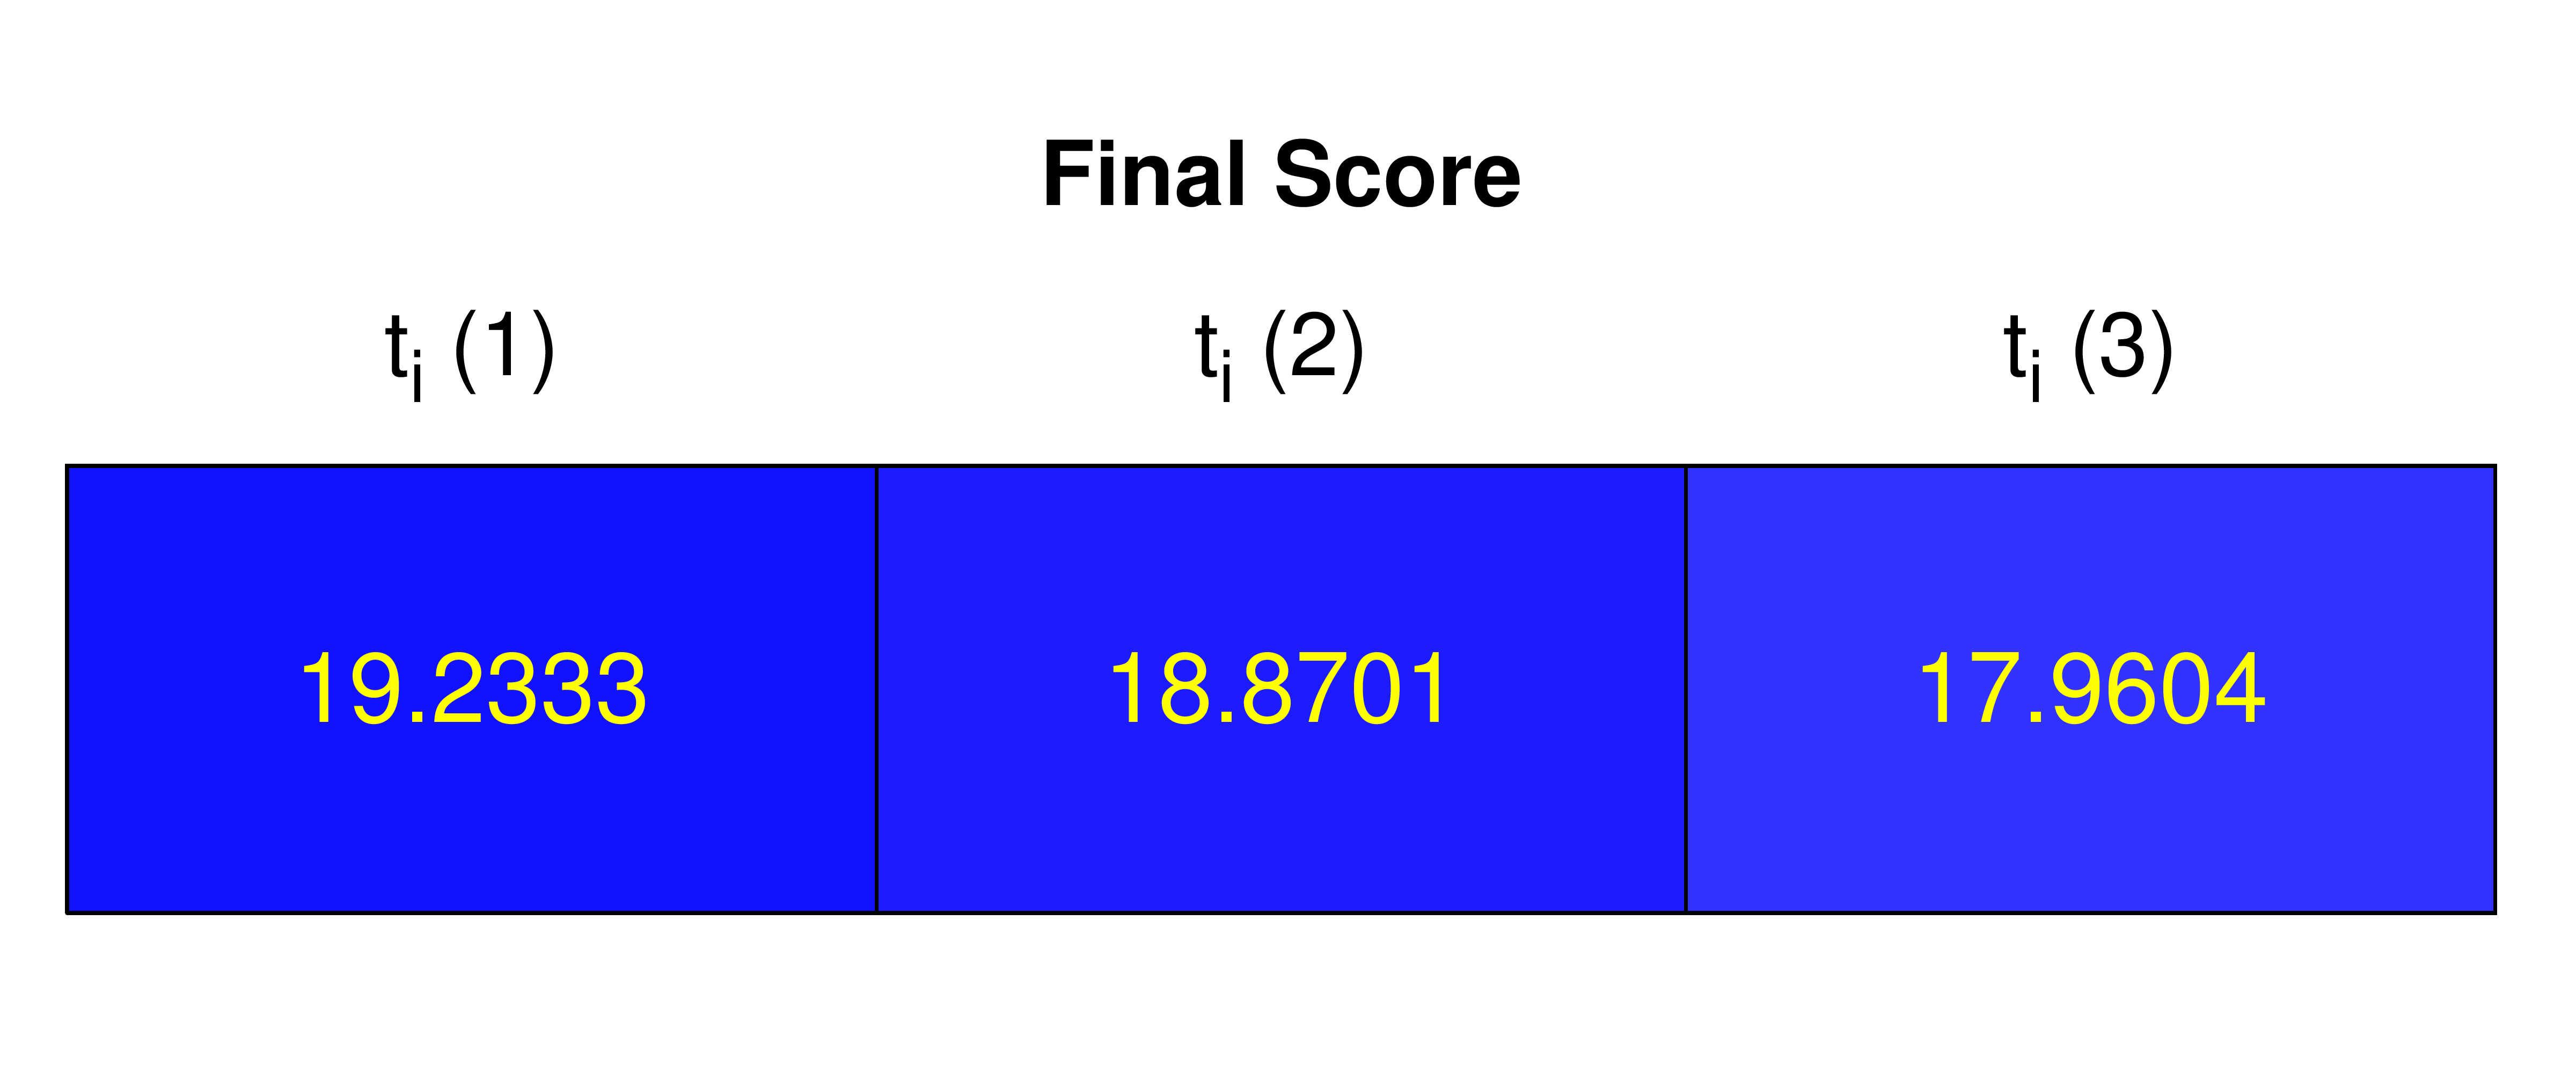
Figure 5. Heatmap representation of the Final Score rating each analysis for each tested initial instant of 0 to 20.
Download Hi-res file
Final Score
A final score evaluating the quality of determined parameters and of the overall enzymatic assay from 0 to 20 is determined for each initial instant analysis.
Score is determined as the weighted average of R2 and K, with weights 75% and 25% correspondingly. The average value of K is obtained for each initial instant analysis, and values of R2 and K are then converted to a scale from 0 to 20 for weighted average determination.